In our first Power BI blog, we introduced the Power BI platform and reviewed the desktop applications and cloud-based tools we can use to develop and share reports and dashboards. In this blog, we’ll look more specifically at the ins and outs of using Power BI with MEDITECH Data Repository.
![]() (If you're looking for a basic tutorial on using Power BI Desktop, Microsoft has excellent and extensive documentation and tutorials for learning Power BI tools and software.)
(If you're looking for a basic tutorial on using Power BI Desktop, Microsoft has excellent and extensive documentation and tutorials for learning Power BI tools and software.)
The Data Repository Schema
The fundamental challenge Data Repository presents to report developers and analysts is its somewhat denormalized schema. Just because it runs on SQL Server doesn’t mean it’s a relational database. DR is atypical in several ways: it lacks foreign key relationships; it has many data points stored in multiple locations; it has many NULL-valued fields, just to name a few. The schema design wasn't built to be relational or with an application front-end in mind – it was built to mirror the hierarchical file storage scheme that MEDITECH uses in its proprietary platforms (MAGIC, C/S and M-AT). And just for fun, starting with M-AT in about 2010, you have two live databases, not just one.
This can be a problem for Power BI Desktop and any software (shout out to Crystal Reports!) that expects you to connect to a relational source and discover an ideal table schema, with all relationships defined, so you can quickly point and click to the fields you want on a report. We know DR doesn’t work like that, so to effectively use Power BI Desktop and Report Builder, you have to do a bit more work when defining what’s commonly referred to as your data model.
Data Connectivity Options
The first step in setting up your data model is establishing connections to data sources. Power BI Desktop offers two data connectivity options for working with SQL Server databases: Import and DirectQuery. The Import option, as its name implies, imports your data into PBI, where it’s compressed and cached for near-instant presentation on reports and dashboards. This is the default option, and recommended for most cases, as it has an abundance of available data sources, lets you optionally use PBI’s DAX (Data Analysis Expressions) language for advanced calculations and custom queries, and offers fantastic performance. The only limitation to the Import method is the cached data size of 1GB, which doesn’t sound large, but actually is, due to efficient compression. (With a Power BI Premium license, this increases to 50GB.) For most DR-based report scenarios, the 1GB limit is enough. The other consideration here is how “current” the data needs to be, as it does need to be refreshed, which you can schedule to run up to eight times a day with the Power BI Professional license.
The DirectQuery method gives you an alternative to the 1GB limitation and “point-in-time” nature of the import method. While it does offer real-time data access to larger datasets, it has its own limitations: performance is slower (depending on the type of data source, network latency, the usual suspects); limits some of the DAX functionality; and only allows a single data source per connection (where using Import allows you to combine data from multiple data sources into a single model). For working with Data Repository, we recommend using the Import method, for all but special-purpose reports and application needs.
Modelling Good Behavior
At the heart of designing reports with Power BI Desktop is the data model, or simply model. For many people, when you say “data model,” you may be referring to a traditional star schema, where you simplify your data by defining tables as either fact or dimension tables, with the fact table (e.g., lab tests) at the center, and the dimension tables (those with related data about providers, patient demographics, etc.) radiating outward (hence the “star” name…the design is shaped like a star). While this is one way to optimize reporting, with Power BI, there are other ways too.
Fig 1: star schema

After you’ve defined a new connection as described above, you’ll work with your model to define the relationships between tables, add custom fields and measures, and more. Keep in mind that a “table” in the model isn't necessarily the same thing as a table from DR (although it can be). Tables in the Power BI model are any combination of fields presented from your defined connections, so you can have a simplified schema (not a star schema). By way of example, here’s the model view from Power BI Desktop for a lab report I wrote:
Fig 2: the model
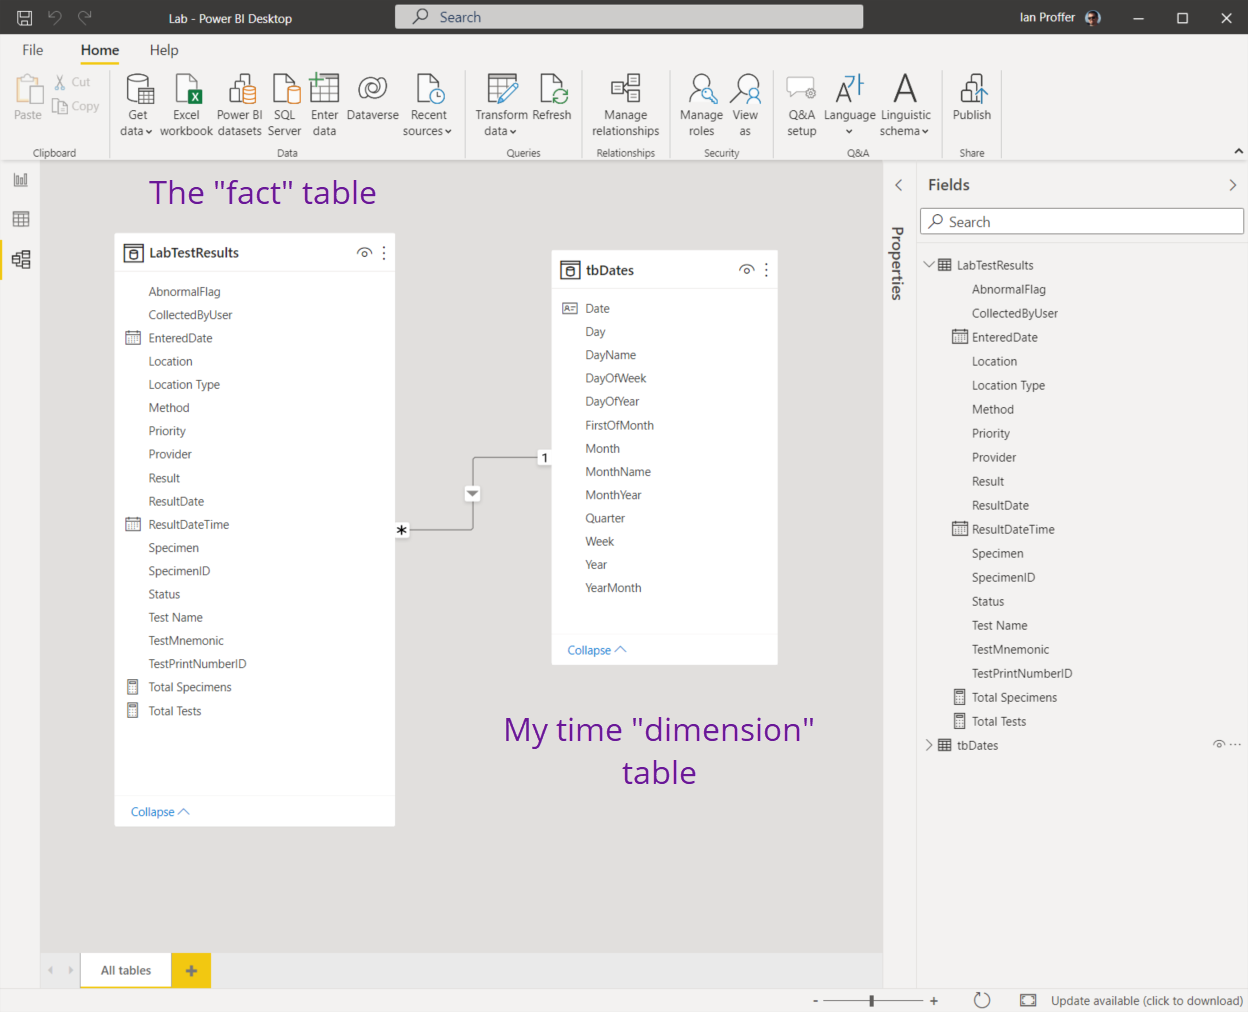
Some things to note: my fact table (LabTestResults) combines data from three DR tables (LabSpecimens, LabSpecimenTests and DLabTest) and includes two measures I added using DAX (Total Specimens and Total Tests). The tbDates table is my own and is a common technique used by analysts to make it easier to display a variety of date formats and intervals (month names, abbreviations, etc.). you can do this with T-SQL functions too, but pre-populating a table with dates and every possible value you might want makes retrieval efficient).
As a general recommendation for Data Repository-based data models, we find that simpler models with a single fact table and perhaps a dimension table or two, as in my example, work very well and are easy to maintain. You can build more complex star schema models, but unless you’re building your own data mart with the express purpose of allowing users to build their own reports with Power BI tools, it’s more work than necessary. Which leads us to a logical question: how do I program for it with T-SQL?
Coding Your Data Model
It’s no secret that we have always supported a simple approach to DR development: write T-SQL stored procedures to produce your data, and save them in a database on the DR server outside of MEDITECH’s databases. With Power BI, our tune is unchanged: use stored procedures.
By default, when you use the SQL Server database connectivity option, you specify a server name and then browse all the available databases, drilling into both tables and views and clicking away. (For my purpose-built tbDates table, I used this method since I always want to include all data from this table for my time-based analysis.) This will be tedious however for your fact table information, and also do nothing for you to relate those objects to each other (since there are no foreign keys defined). A more precise and better-performing alternative: add the optional database name, expand the Advanced options and enter a TSQL command to execute a stored procedure you’ve already written.
Fig 3: using an SP
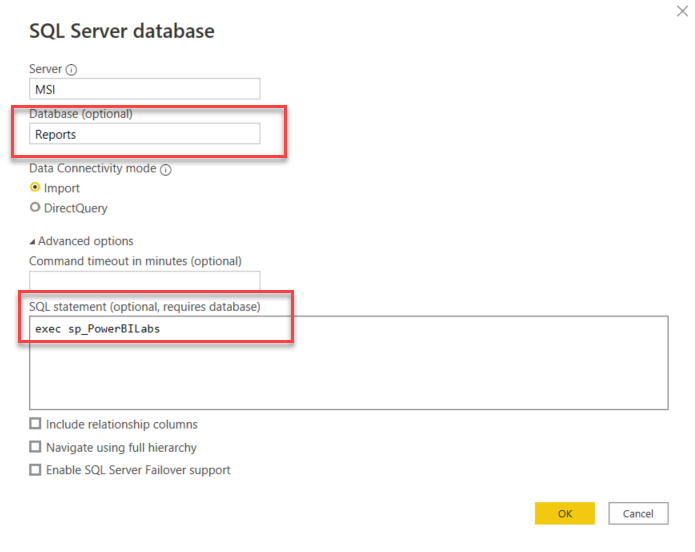
The stored procedure sp_PowerBILabs shown in figure 3 above provides the data for my fact table LabTestResults as shown in figure 2. In effect I’ve pre-simplified my data model by using the stored procedure, where I do all the logic necessary to produce the data:
Fig 4: stored procedure
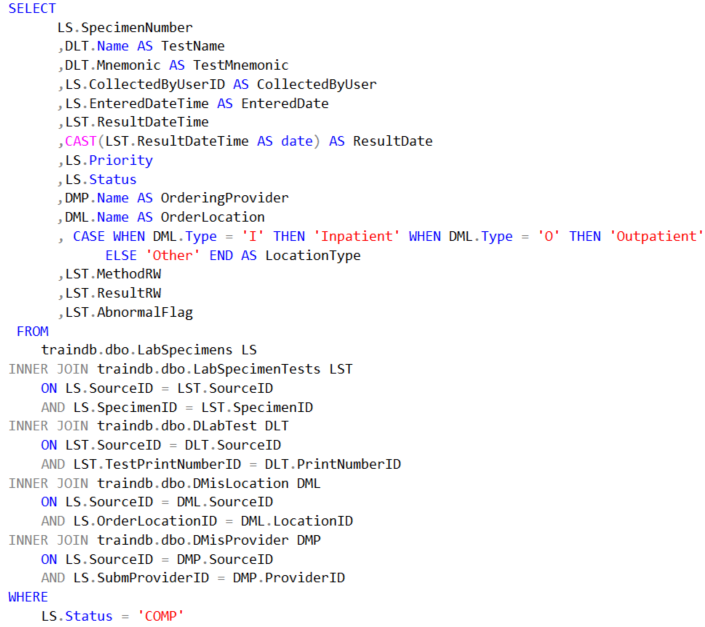
The benefits to this method also include easy modifications: if a user or I decide to add something else to the dataset, I only have to modify the stored procedure, refresh my data in Power BI Desktop and we’re off to the races.
Summary
I hope this blog helps you being to see how effectively we can use Power BI tools with MEDITECH Data Repository.
Take me to the Power BI page for more information, or see the first blog in this series if you missed it.
-- Ian Proffer
Microsoft Certified Power BI Data Analyst Associate