MEDITECH’s Data Repository has come a long way since its inception over twenty years ago. In the early days of DR, usable front-end reporting tools were few and far between: Microsoft Access and Crystal Reports were common choices for many hospitals. Fast forward to 2021 however, and DR is an integral part of the MEDITECH EHR and report developers have a variety of tools to use: the ubiquitous SQL Server Reporting Services (SSRS) from Microsoft; MEDITECH’s BCA with MicroStrategy; and third-party software like Tableau and Qlik, among others.
If you’ve spent any time in the so-called world of business intelligence or analytics, you’ve likely also run across Microsoft’s Power BI, which may seem fairly new. Power BI however, in its earliest incarnation as an Office 365 component came out in 2013 and since 2015 has been available as a standalone analytics platform. We at Acmeware and just beginning to see Power BI in use at MEDITECH hospitals, and all hype aside, it can truly be a game changer for DR, and has the potential to become the informatics platform of choice.
What is Power BI?
Microsoft says it best: “Power BI is a collection of software services, apps, and connectors that work together to turn your unrelated sources of data into coherent, visually immersive, and interactive insights.” (See more from Microsoft.) The basic components of Power BI include Power BI Desktop, a no-cost application used to define data sources and data models, optionally transform data, and design report visuals and dashboards; the Power BI service, a cloud-based service where you share reports and dashboards with your organization; and Power BI mobile apps, another option for sharing dashboards and reports with your audience. (As yet, we haven’t seen hospitals eager to consume analytics via mobile device.)
The basic workflow goes like this: starting with Power BI Desktop, you can connect to different sources of data and combine them into a data model. Then you design reports and dashboards, including any combination of visualizations and data tables based on that data model. Your content is then shared to the Power BI service as a report or an app, where your users can interact with it. Reports and apps are also available using the Power BI mobile apps.
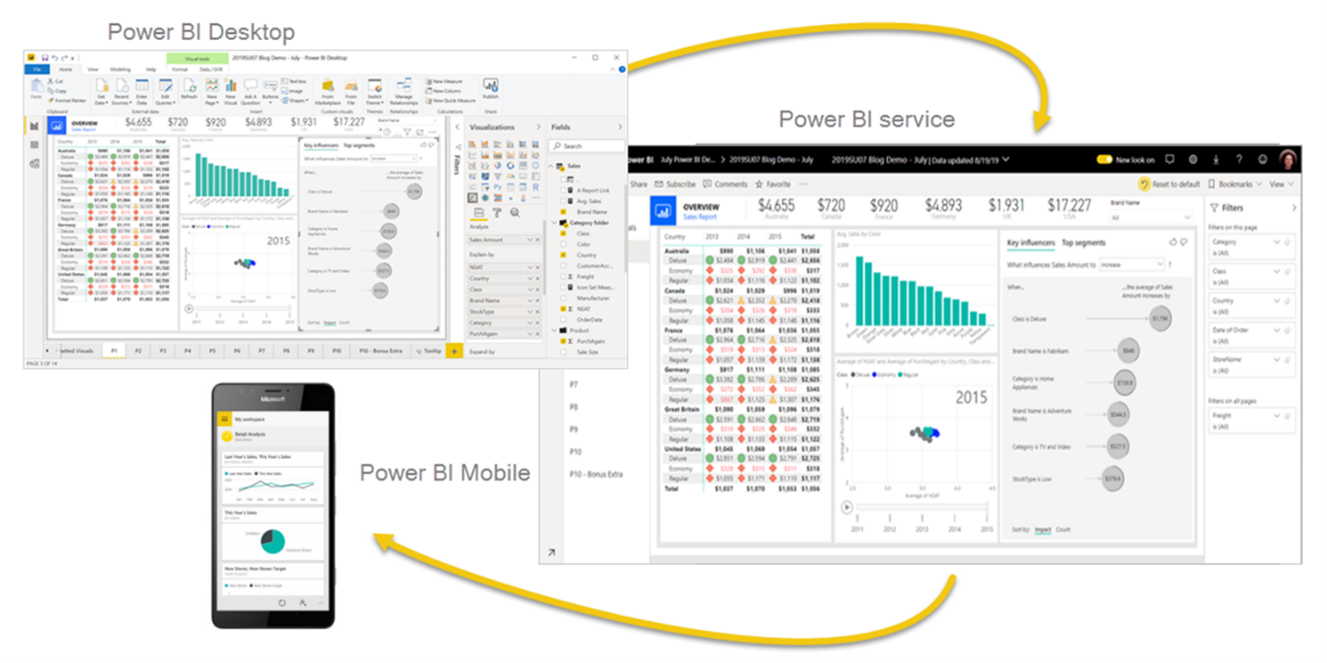
Power BI Desktop can get data from an impressive array of sources, well beyond the obvious flat files, Excel spreadsheets, and SQL Server databases. From database systems like Oracle, DB2, and MySQL to online services including SharePoint and Azure-based apps, Salesforce, Google Analytics, GitHub, Hadoop files – the list is long. Desktop is more than just a connection tool too: it includes the Power Query Editor to extensively transform data as you need to fit your model, including modifying data types, adding or removing columns, and more: think of it like an ETL tool.
The Power BI service (sometimes called Power BI online) is the cloud-based site where you share your reports and dashboards, so your users can interact with them, not just viewing data, but dynamically filtering, drilling-down and “slicing and dicing” it, based on what you’ve built using Power BI Desktop. The idea is to bring all the relevant data together from disparate sources so you can see not just the big picture, but all the smaller pictures too, from summary to detail (graphic courtesy of Microsoft).
Power BI and SQL Server Reporting Services
There’s more too, which will sound familiar if you’re already using SSRS: a desktop application called Power BI Report Builder (until recently, Microsoft Report Builder) used to design “traditional” paginated reports (think of stuff you consume via .pdf or from a page formatted for printing). Finally, there’s Power BI Report Server, an on-premises report server to host both paginated reports and Power BI reports (those written with Power BI Desktop, which have a .pbix extension). This begs the question: what’s up with SQL Server Reporting Services?
SQL Server Data Tools/Visual Studio and the Report Server web portal are still available, but greatly de-emphasized by Microsoft. Report Builder has been used for years as a tool to author standalone reports with the .rdl extension and has many of the capabilities of the Visual Studio-based SQL Server Data Tools (SSDT). In other words, if you’re developing SSRS reports, you’re already using either SSDT or some flavor of Report Builder. Unlike SSDT, which allows you to have many reports grouped together as a project (with shared data sources and datasets), Report Builder reports are one and done.
Power BI Report Server is like the Reporting Services web portal in that it’s inside your firewall but has a superset of SSRS’ functionality since it can host both paginated reports and anything you develop with the “old” SSRS tools, as well as reports and dashboards from Power BI Desktop. As of this writing, there is no equivalent of SSDT for the Power BI suite. From what I can glean from Microsoft's information, SQL Server Reporting Services an Power BI will co-exist, at least for now.
Summary
Microsoft's Power BI tools and applications are definitely making it easy to create and share impactful analytics reports and dashboards. In our next blog, we'll talk more specifcally about using Power BI tools to develop with MEDITECH Data Repository-based datasets and models, with an eye toward what's simlilar to using SSRS, and what sets Power BI apart from traditional tools.
-- Ian Proffer
Microsoft Certified Power BI Data Analyst Associate