I’ve been working with MEDITECH Data Repository since 2000. That’s longer than I care to note, but I still remember when SQL Server Reporting Services was first included with SQL Server, in version 2000: after struggling to find an easy way for our small hospital to share DR data and reports without having budget dollars for software like Crystal Reports, suddenly we could share it on our intranet.
![]()
To transition from Excel spreadsheets in email (or still printing and putting reports in someone’s company mailbox), to a website for staff self-service reporting was a huge improvement. Here we are 20+ years later, and while SSRS is still widely used, newer and easier to use tools from Microsoft are growing in popularity, specifically the Power BI applications and services. As a company, we’re convinced that Microsoft Power BI is the best reporting platform to use with MEDITECH Data Repository. Let’s explore some of the reasons why. Over the course of two blogs, I'll look at three different areas to make the comparison: report design tools, report management, and end-user presentation. For part one, let's look at report design and online management.
Report design tool – Microsoft Power BI Desktop is the starting point for building visualizations, reports, and dashboards. It is decidedly intuitive and easy for beginners to use, with the familiar Microsoft conventions of objects on a palette that you drag and drop onto a blank canvas. Adding data fields, changing visual properties and the like is simple to do. There’s a lot of functionality built into a well-defined space.
If we compare this to designing reports with SSRS and Microsoft Report Builder, SQL Server Data Tools (SSDT), or any of the Visual Studio-based tools that preceded it, it’s like night and day. While SSDT is powerful, it’s complicated: just defining and distinguishing the data source and dataset are not straightforward, and when presented with a blank design space, adjusting properties for tables or matrixes turns into an exercise in excessive mouse clicks, trying to click on the precise spot to adjust a particular property, or even edit a simple text label. And while you can preview the report to see how it looks as you build it, it’s a few extra clicks to start the process, wait for the report to render, and provide parameters if necessary. It’s slow.
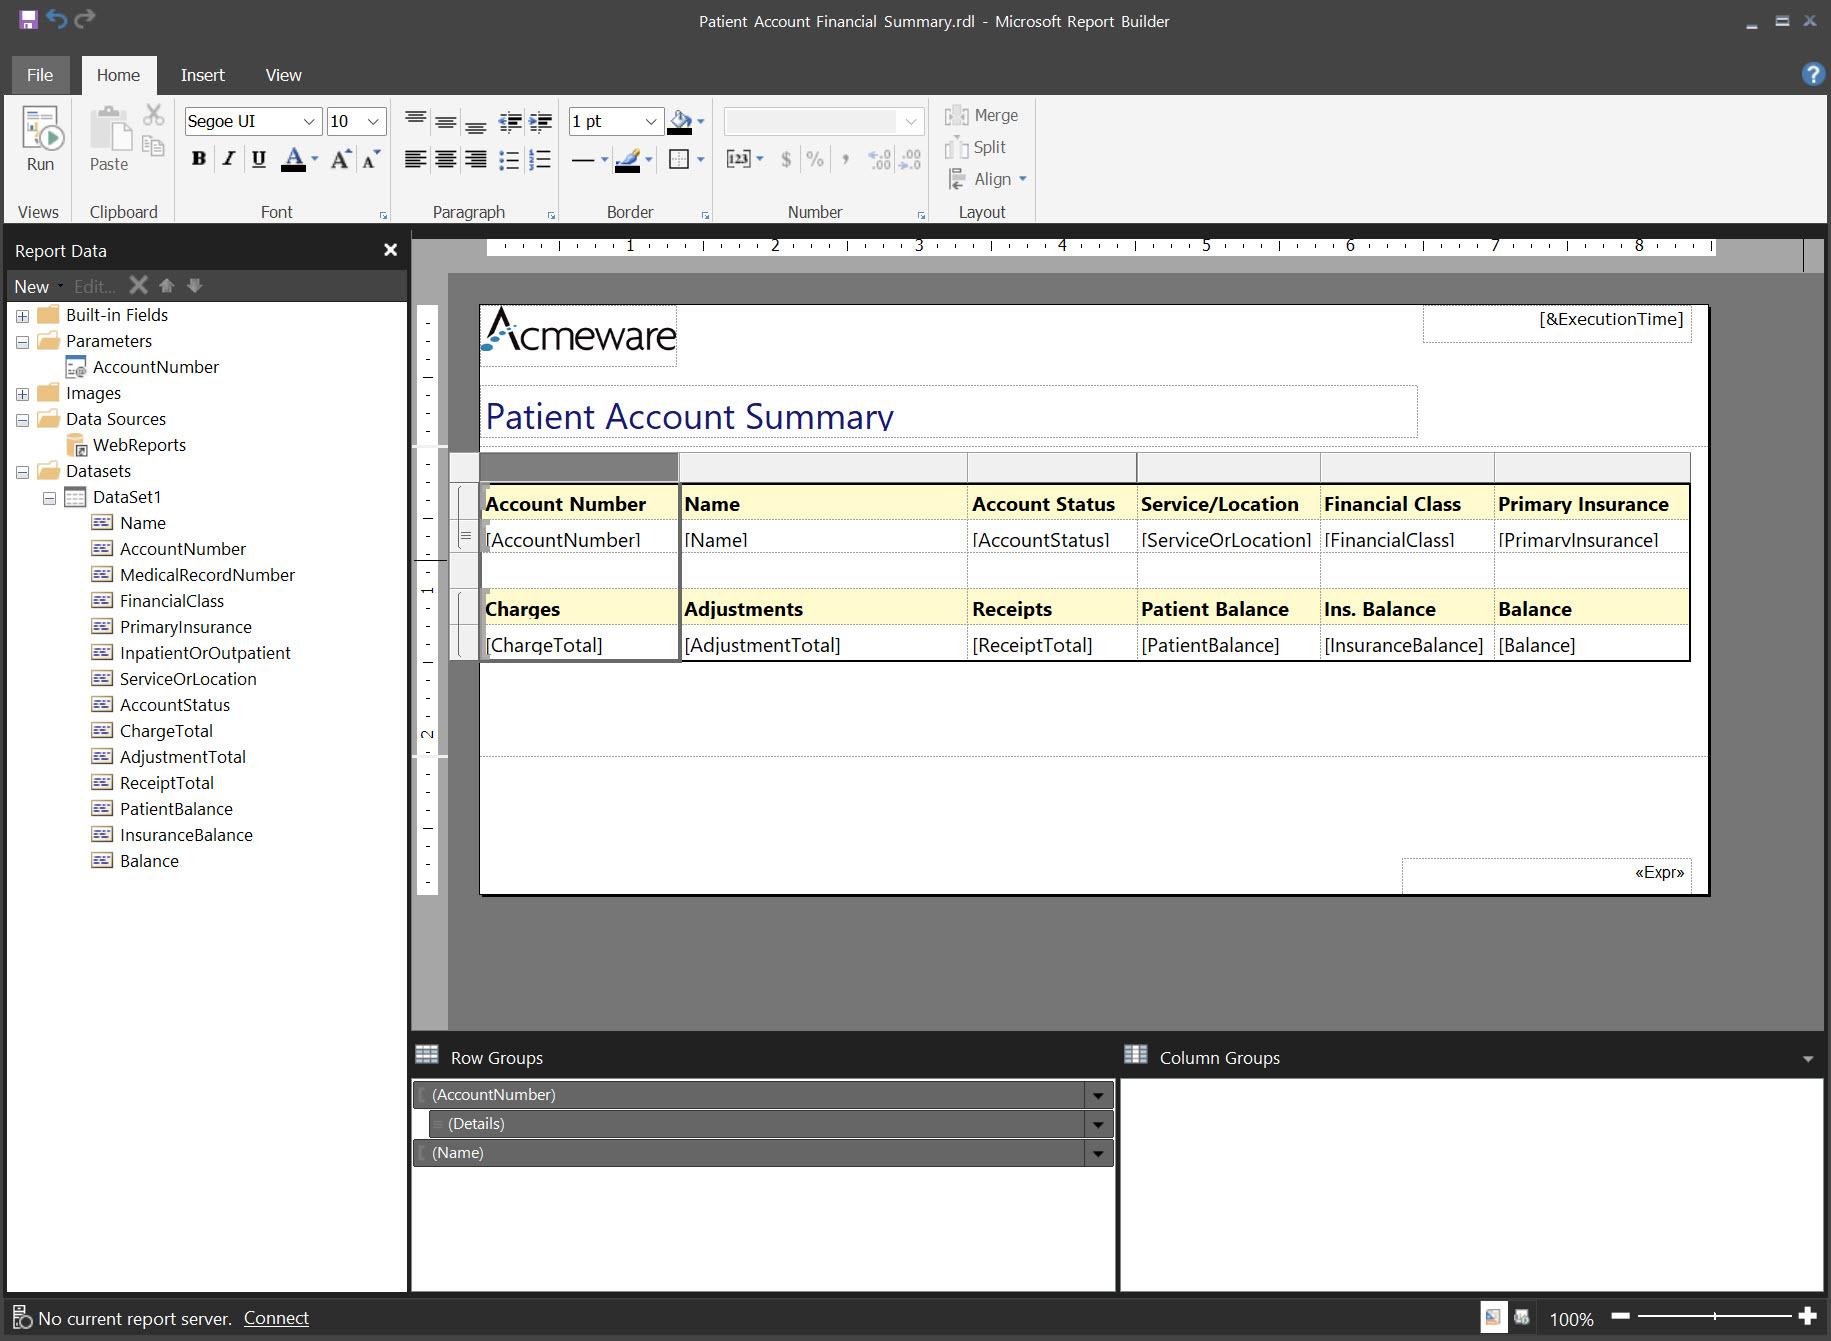
Designing an SSRS paginated report with Report Builder
With Power BI Desktop, since your data are part of the report itself (as part of the data model), you see the data as you work with it. Every change you make that affects a visual (a font change, a filter, adding a new field or measure to the visual, etc.) is instantly visible in the design space. With this kind of visual feedback, as a report designer it’s much faster to design, test, make a change, and test again.
Power BI Desktop is more than just a report design tool: it has full-blown data modelling and ELT (extract, load, and transform) capabilities too. Power BI data sources use Microsoft Power Query connectors to connect to dozens and dozens of different sources; naturally it’s very easy to connect to SQL Server, Excel and the like, but there are dozens of dozens of other systems’ data you can bring in to Power BI, including databases, cloud-based applications – the list is extensive.
Designing a report with Power BI Desktop

Once connected, you can use Power Query to further scrub or otherwise manipulate the data before incorporating it into your report: remove duplicate values, modify data types, add custom columns, and more. While this type of work is not for the beginning user, it demonstrates that behind the simple to use approach with Power BI Desktop lie very powerful data manipulation capabilities.
In brief, the ease of use and under-the-covers data manipulation ability in Power BI Desktop is on another level for developers compared to legacy Visual Studio SSRS tools.
Report sharing and management – once published or shared online, what is the report and user administration and management experience like in Power BI versus SSRS? In fact, they are quite similar, in terms of what tasks an administrator can do: both let you share reports with users by publishing them online. SSRS publishes to an intranet web portal; Power BI to the Power BI service for your organization, hosted by Azure as part of your M365 package. (Power BI can also optionally publish to an intranet server too but requires a more capable and expensive license.)
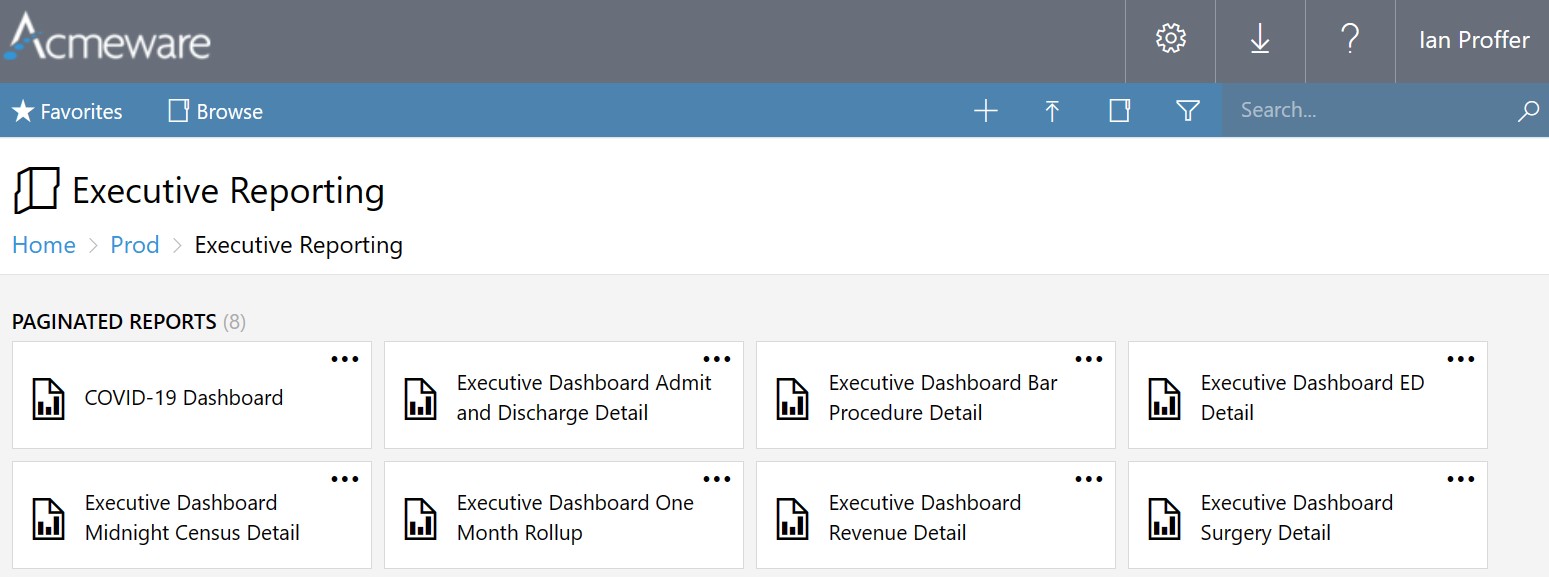
Both let you organize reports into groups of a sort: SSRS follows a folder and subfolder model, as the example below illustrates. You can see the breadcrumb folder navigation ("Home > Prod > Executive Reporting") which shows us the list of paginated reports available within the folder:
Folder and report view in SSRS web portal
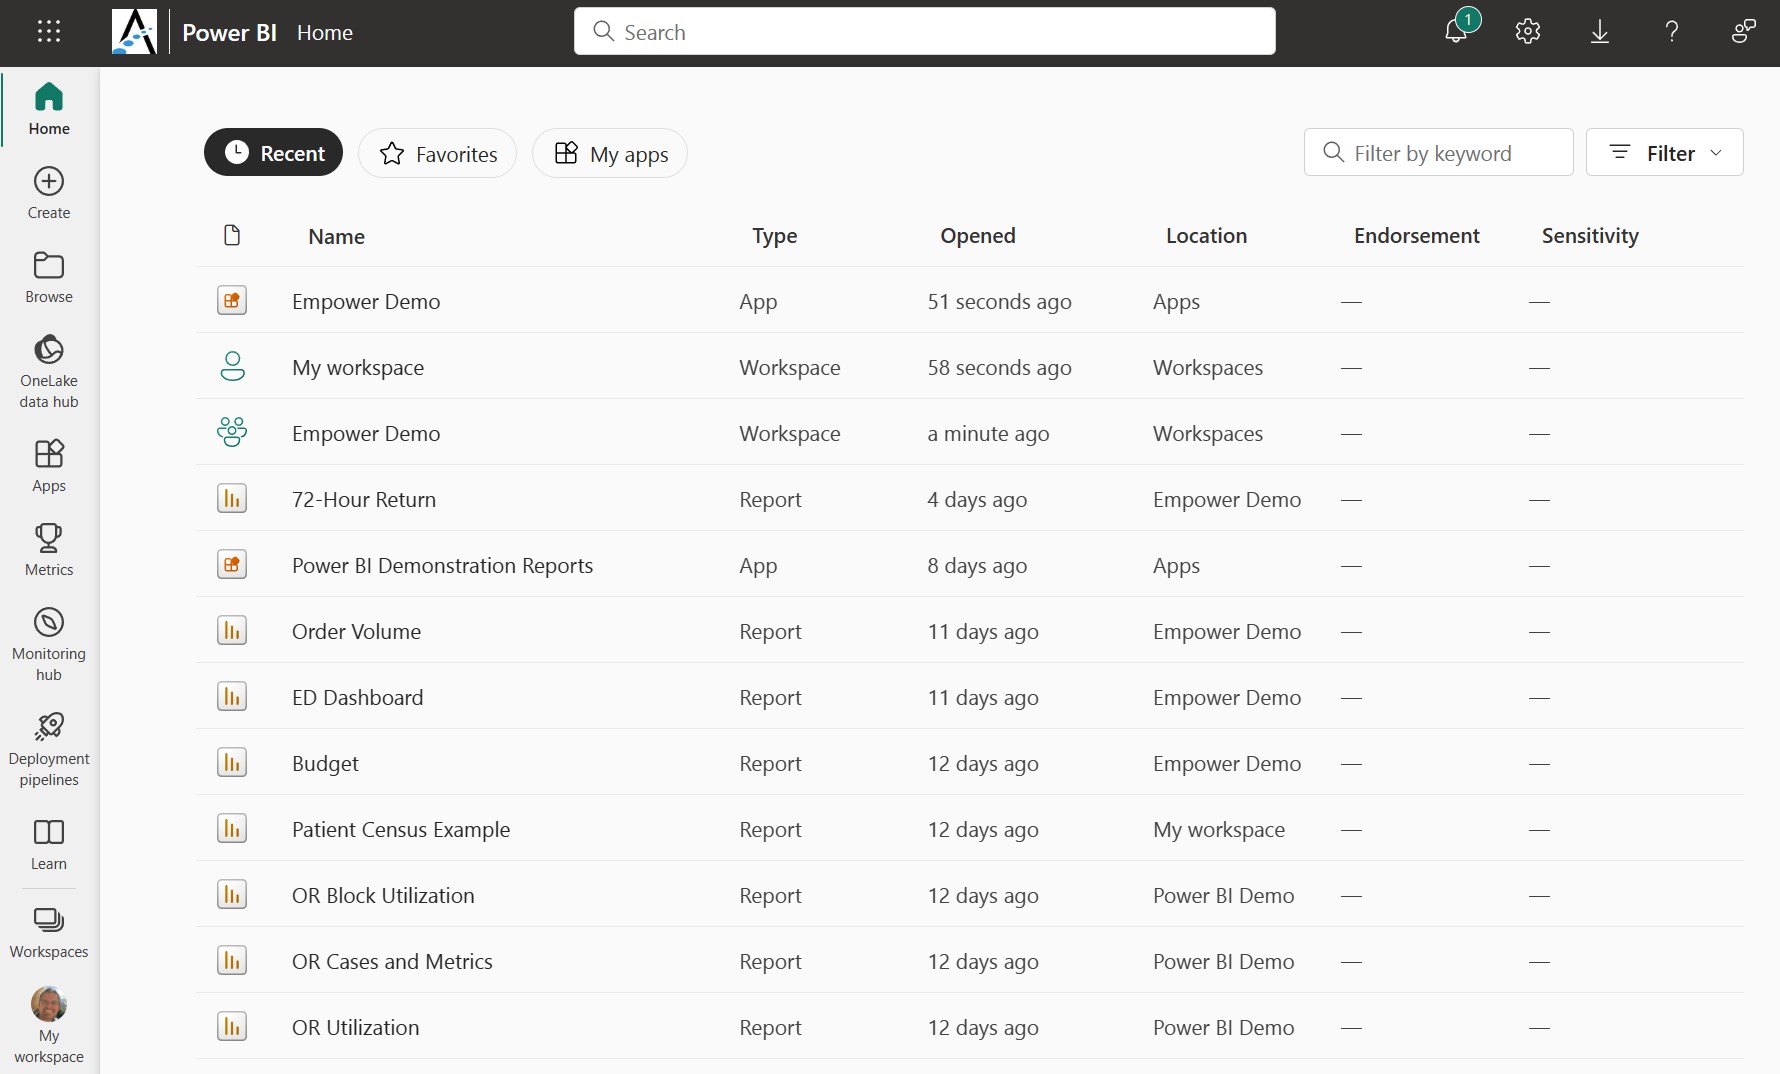
Once logged in to your Power BI service (using your Microsoft 365 credentials), you can see how Power BI displays the list of workspaces, apps, and reports that you have access to:
Power BI service home page
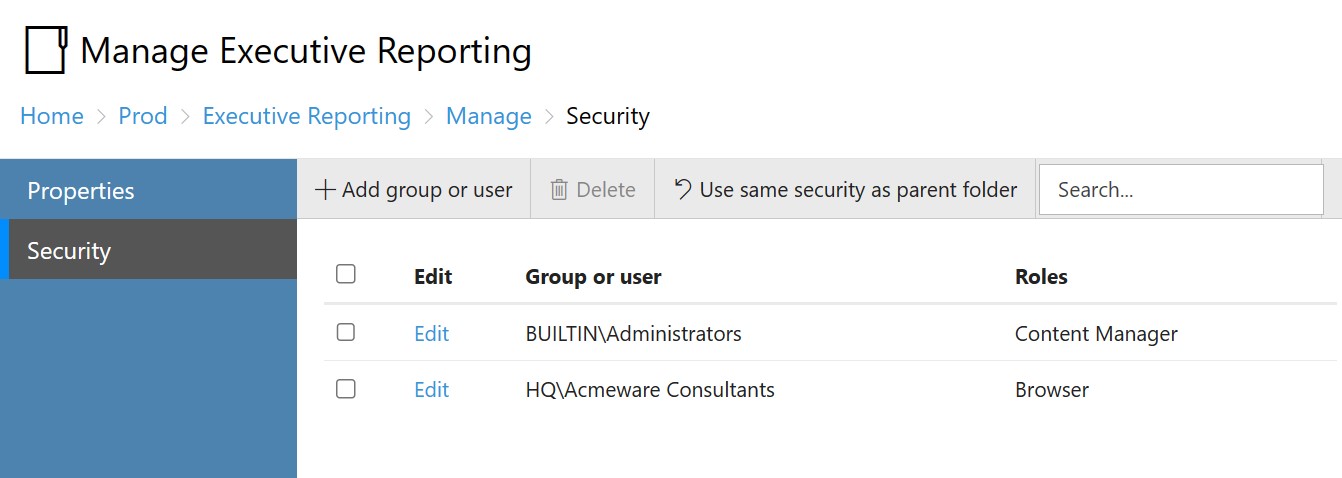
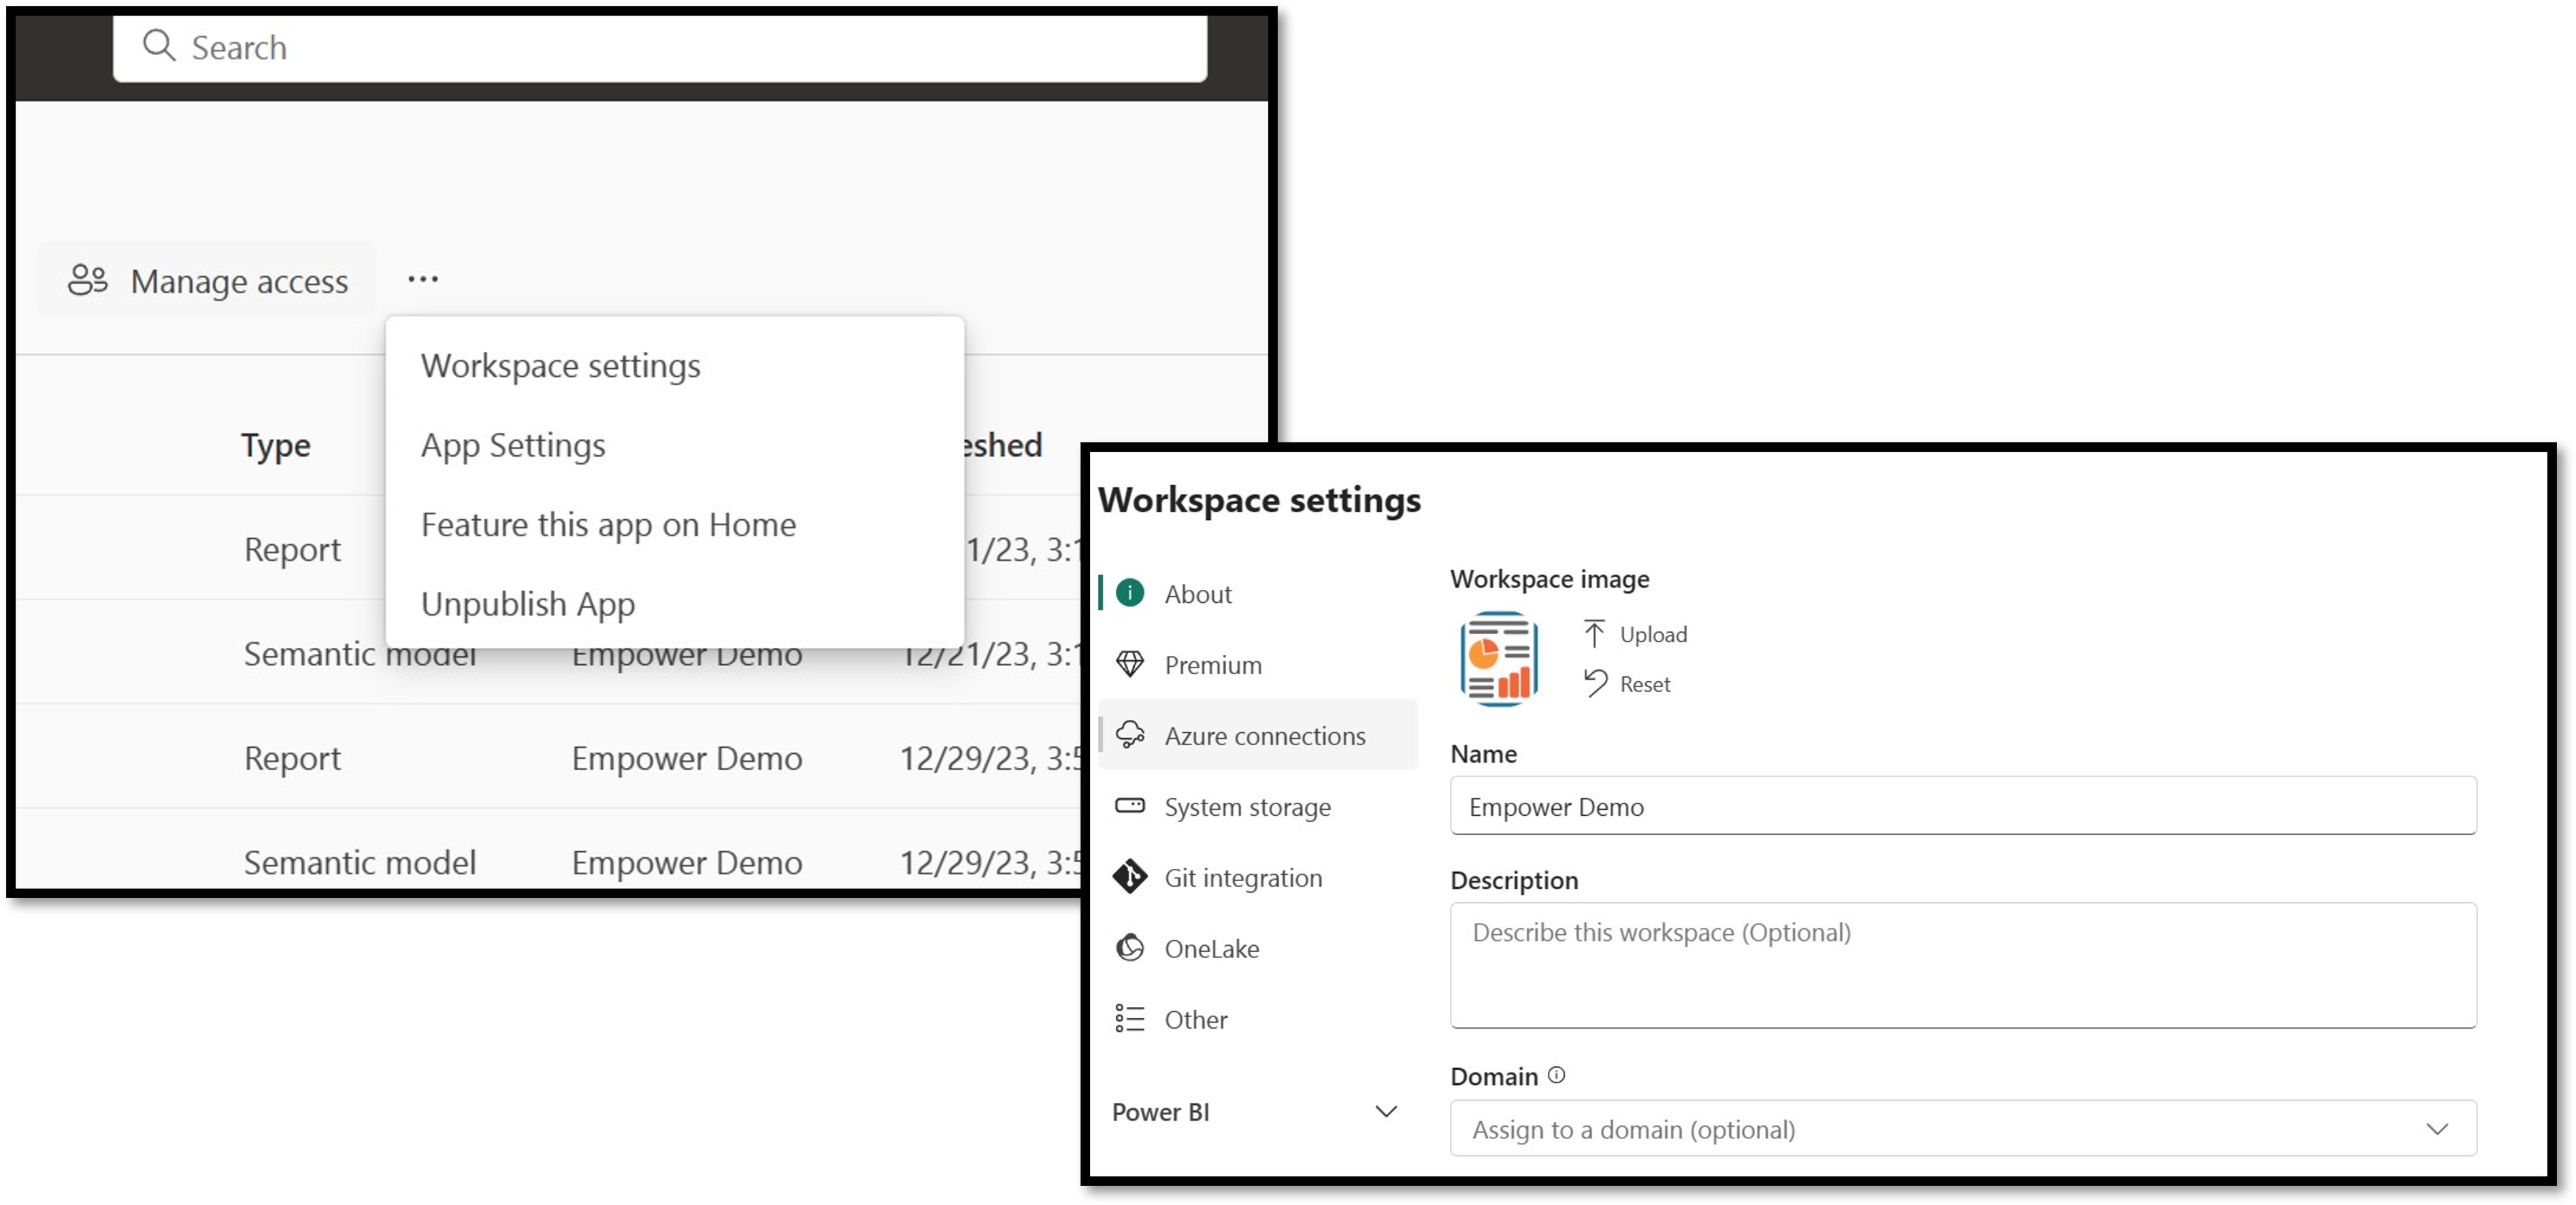
Both the SSRS web portal and the Power BI service of course let administrators manage settings and properties for the various components they use (folders or workspaces, schedules, user security, etc.). For managing user access, SSRS uses existing Active Directory groups and users, while Power BI relies on M365 groups and users (which can be integrated with your AD domain setup). User permissions in both cases are defined by assigning groups (or individual users) to a role for a folder or workspace, ranging from view-only permissions (a “Browser” for SSRS; a “Viewer” in Power BI) to full control for an administrator: “Content Manager” in SSRS or "Admin” for Power BI workspaces.
Managing security properties from the SSRS web portal
Managing workspace settings in Power BI
While the capabilities of both platforms are aligned, how you go about performing various actions just has a different look and feel. The best I can describe the difference is this: managing the web portal in SSRS will be familiar to anyone that started using Microsoft web applications 15 or 20 years ago. You can get to everything you need, but it sometimes feels “click heavy.” Poke around until you find the right function and there it is. With Power BI on the other hand, navigating to workspaces, managing settings, and assigning user access roles is “cloud first” in terms of design and overall interaction. Fewer clicks and a cleaner experience.
Summary
In part one of this blog, I've begun to illustrate why Acmeware and our clients have started a journey of shifting from the well-established SQL Server Reporting Services tools to Power BI. I've touched on just the tip of the iceberg, but starting with the report design applications and online manageability, I hope I've inspired you to make some comparisons for yourself, and consider Power BI as the best analytics solution for Meditech hospitals. In the next part of this blog, I'll continue with comparisons of the user experience between SSRS and Power BI.
-- Ian Proffer
Microsoft Certified Power BI Data Analyst Associate
Read more of our Power BI Advisor blogs.
See what Power BI-based solution Acmeware is offering our clients.