


Healthcare AI Data Foundation
Featured article
Artificial intelligence has quickly become one of the most discussed opportunities in healthcare. Learn why the data foundation is citical
Microsoft Power BI is a versatile analytics platform gaining adoption at MEDITECH hospitals for Data Repository reporting. It offers significant advantages over legacy tools like Crystal Reports and even SSRS.
MEDITECH's Data Repository has evolved significantly over two decades. Early reporting relied on tools like Microsoft Access and Crystal Reports. Today's environment offers multiple options including SQL Server Reporting Services (SSRS), MEDITECH's BCA with MicroStrategy, and third-party platforms like Tableau and Qlik.
Microsoft Power BI, though appearing recent, originated as an Office 365 component in 2013 and became a standalone platform in 2015. Acmeware is beginning to see adoption at MEDITECH hospitals, and it can truly be a game changer for DR, with the potential to become the informatics platform of choice.
Microsoft defines it as "a collection of software services, apps, and connectors that work together to turn your unrelated sources of data into coherent, visually immersive, and interactive insights."
Basic components include:
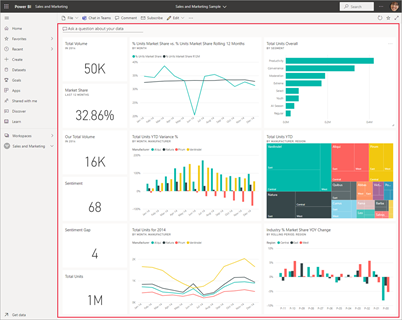
The workflow begins in Power BI Desktop, where users connect disparate data sources and combine them into a data model. Reports and dashboards are then designed and shared to the Power BI service for interactive user consumption.

Power BI Desktop connects to numerous sources beyond spreadsheets and SQL Server databases, including Oracle, DB2, MySQL, SharePoint, Azure apps, Salesforce, Google Analytics, GitHub, and Hadoop files. It includes the Power Query Editor for extensive data transformation: adding/removing columns, modifying data types, and similar ETL functions.
The Power BI service enables users to interact dynamically with reports and dashboards, filtering, drilling down, and analyzing data across summary and detail levels.
Additional tools include Power BI Report Builder for designing paginated reports (suitable for PDF or print formats) and Power BI Report Server, an on-premises solution hosting both paginated and Power BI reports.
Microsoft has de-emphasized traditional SQL Server Reporting Services. While SSDT and Report Builder remain available, Power BI represents the platform's future direction. Power BI Report Server functions similarly to the Reporting Services portal but offers a superset of SSRS functionality, hosting both traditional paginated reports and Power BI Desktop reports (.pbix files).
SQL Server Reporting Services and Power BI are expected to coexist for the foreseeable future.
Power BI tools simplify creating and sharing impactful analytics. The next article explores using Power BI specifically with MEDITECH Data Repository datasets, examining similarities to SSRS and distinguishing Power BI's advantages.